CST毫米波雷達模擬解決方案介紹(三)

本期我們將介紹陣列天線模擬。陣列天線可以獲得窄波束、高增益和精確的方向性,因此可以全面提升雷達的偵測性能。

The image shows a simulation model in CST software, depicting a multi-layered structure with several rectangular components connected by lines. There are red markers labeled with numbers 3 and 5, and coordinate axes labeled u, w, and y. The background is a light blue grid, and the image includes the CST logo in the bottom right corner.

本例模擬物件為一個毫米波雷達的TX天線,其y方向上由5個相同結構的串聯貼片陣子組成。

The image shows two 3D radiation pattern plots of antennas simulated using CST software. The left plot depicts a rectangular patch antenna with a red and green radiation pattern, indicating the gain in dBi. The right plot shows a more complex antenna array with a similar radiation pattern. Both plots include coordinate axes (x, y, z) and color scales indicating gain values in dBi, ranging from -25 to 15 dBi on the left and -18 to 22 dBi on the right.

從上圖的比較可以看出,採用陣列結構(右圖)以後,天線的增益比單陣子(左圖)提升了7dB,y方向的波束變得更加集中,指向更加精確。

對於完整陣列的模擬需要更多的運算資源和時間,在陣子設計之後,為了快速評估天線陣列的性能,這裡我們介紹一種快速的波束合成的方法。具體方法如下:

1. 對單天線進行模擬後,得到遠場結果。

A 3D visualization of an antenna radiation pattern. The image shows a color-coded radiation pattern in dBi, with a scale ranging from -25 to 15 dBi. The pattern is displayed on a coordinate system with x, y, and z axes labeled. The Theta and Phi angles are also indicated. The radiation pattern is depicted as a multi-colored surface, with red indicating the highest gain and blue indicating the lowest gain. The image includes a small inset with a 3D coordinate system for reference.

2.選取遠場結果, 點選Array factor圖標,對Array type進行設置,這裡我們在y方向定義5個elements,間距設定一個參數y_space,方便後續的參數修改。點選update list更新下方表格。

The image shows a software interface for the farfield calculation of antenna arrays. The interface includes options to activate the farfield array and select the array type (Rectangular or Userdefined). For the Rectangular array settings, there are fields for Elements in x, y, z, Spaceshift in x, y, z, and Phaseshift in x, y, z. The Antennas section lists five antennas with their respective coordinates (X, Y, Z), Amplitude, and Phase. The interface also has buttons for Import TSV, Import Array Task, Add, Modify, Delete, OK, and Cancel.

3.根據實際陣列設計,點選自訂修改每個連接埠的Amplitude,從上到下分別為0.5、0.9、1、0.9、0.5。
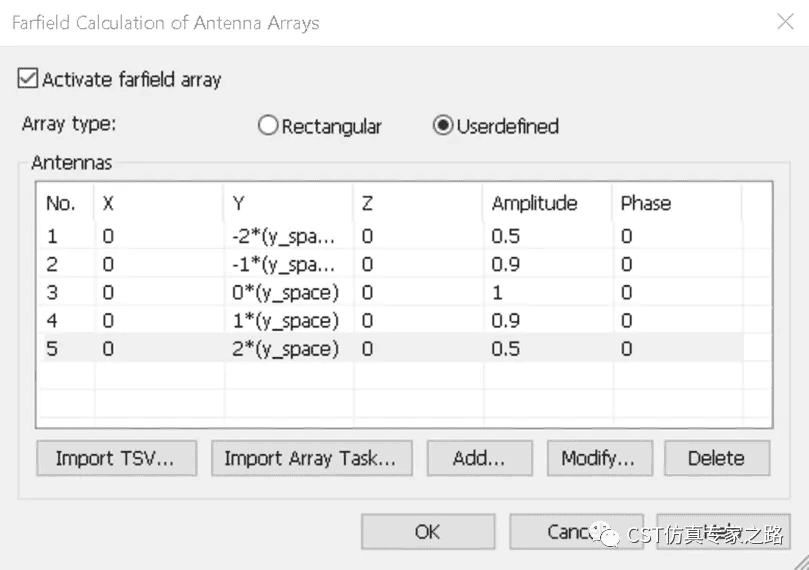
Farfield Calculation of Antenna Arrays dialog box with 'Activate farfield array' checkbox checked. Array type options include 'Rectangular' and 'Userdefined', with 'Userdefined' selected. The table lists 5 antennas with columns for No., X, Y, Z, Amplitude, and Phase. Antenna positions are defined in terms of 'y_space' with varying amplitudes and zero phases. Buttons at the bottom include 'Import TSV...', 'Import Array Task...', 'Add...', 'Modify...', 'Delete', 'OK', and 'Cancel'.

點選ok後,即可以得到波束合成後的結果。

4 、比較單陣子combine和5個陣子同時激勵的結果,可以看到兩個結果一致性非常好。

The image shows two 3D radiation pattern plots of antennas simulated using CST software. The left plot depicts a rectangular antenna with a radiation pattern extending upwards along the z-axis, with color gradients indicating different dBi levels. The right plot shows a more complex antenna array with a similar upward radiation pattern. Both plots include coordinate axes (x, y, z) and color scales for dBi values, ranging from -18.8 to 21.2 dBi on the left and -18.9 to 22.2 dBi on the right.

比較2D遠場方向圖的不同切面,兩種方法所得結果幾乎相同。

A polar plot showing two radiation patterns for an array factor at frequency f=77. The orange line represents the array factor, and the red line represents the simultaneous pattern. The plot is labeled with theta in degrees and magnitude in dB, with values ranging from -90 to 90 degrees and -80 to 40 dB. The plot is titled '1D Results New Folder'.

原文轉載來自: 周明 – CST毫米波雷达仿真解决方案介绍(三)

系列文章:

CST 毫米波雷達模擬(一)
CST毫米波雷達模擬(二)
CST毫米波雷達模擬解決方案介紹(三)

看更多其他文章:

CST電動車EMC模擬(十)——電動車母排(Busbar)電磁及熱模擬
CST毫米波雷達模擬(二)
在CST虛擬雙生上模擬靜電放電

發表迴響

返回頂端